Stephen Curry: Season Trends and Shooting Efficiency
A chart-based analysis of Curry’s scoring, playmaking, and three-point shooting over time.
Original Dataset
The dataset below shows Stephen Curry’s season statistics used to generate the charts.
| Season | GP | MIN | PTS | AST | 3PM | 3PA | 3P% | FG% | FT% |
|---|---|---|---|---|---|---|---|---|---|
| 2010-11 | 74 | 33.6 | 18.6 | 5.8 | 2.0 | 4.6 | 44.2 | 48.0 | 93.4 |
| 2011-12 | 26 | 28.1 | 14.7 | 5.3 | 2.1 | 4.7 | 45.5 | 49.0 | 80.9 |
| 2012-13 | 78 | 38.2 | 22.9 | 6.9 | 3.5 | 7.7 | 45.3 | 45.1 | 90.0 |
| 2013-14 | 78 | 36.5 | 24.0 | 8.5 | 3.3 | 7.9 | 42.4 | 47.1 | 88.5 |
| 2014-15 | 80 | 32.7 | 23.8 | 7.7 | 3.6 | 8.1 | 44.3 | 48.7 | 91.4 |
| 2015-16 | 79 | 34.2 | 30.1 | 6.7 | 5.1 | 11.2 | 45.4 | 50.4 | 90.8 |
| 2016-17 | 79 | 33.4 | 25.3 | 6.6 | 4.1 | 10.0 | 41.1 | 46.8 | 89.8 |
| 2017-18 | 51 | 32.0 | 26.4 | 6.1 | 4.2 | 9.8 | 42.3 | 49.5 | 92.1 |
| 2018-19 | 69 | 33.8 | 27.3 | 5.3 | 5.1 | 11.7 | 43.7 | 47.2 | 91.6 |
| 2019-20 | 5 | 27.9 | 20.8 | 5.2 | 2.4 | 9.8 | 24.5 | 40.2 | 100.0 |
| 2020-21 | 63 | 34.2 | 32.0 | 5.8 | 5.3 | 12.7 | 42.1 | 48.2 | 91.6 |
| 2021-22 | 64 | 34.5 | 25.5 | 6.3 | 4.5 | 11.7 | 38.0 | 43.7 | 92.3 |
| 2022-23 | 56 | 34.7 | 29.4 | 6.3 | 4.9 | 11.4 | 42.7 | 49.3 | 91.5 |
| 2023-24 | 74 | 32.7 | 26.4 | 5.1 | 4.8 | 11.8 | 40.8 | 45.0 | 92.3 |
| 2024-25 | 70 | 32.2 | 24.5 | 6.0 | 4.4 | 11.2 | 39.7 | 44.8 | 93.3 |
| 2025-26 | 37 | 31.6 | 27.3 | 3.7 | 4.5 | 11.6 | 39.0 | 46.8 | 93.1 |
Chart 1: Points Per Game Over Time
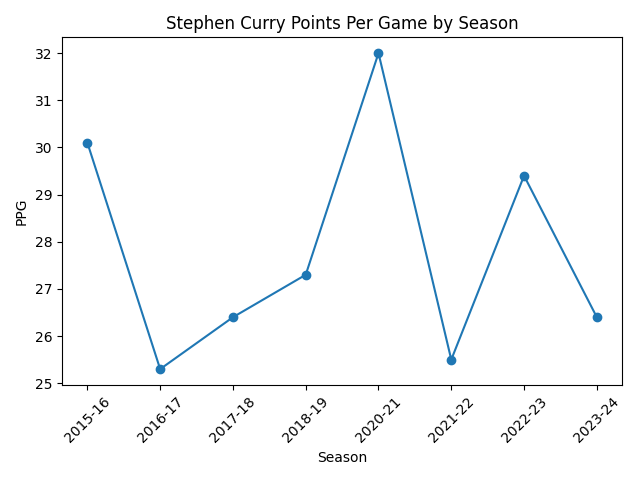
Analysis: This chart shows that Curry’s scoring stayed elite across many seasons, with a major peak in 2015-16 and another strong stretch in 2020-21 and 2022-23. A line chart works well here because it highlights change over time and makes his scoring consistency easy to see.
Chart 2: Assists vs. Points by Season
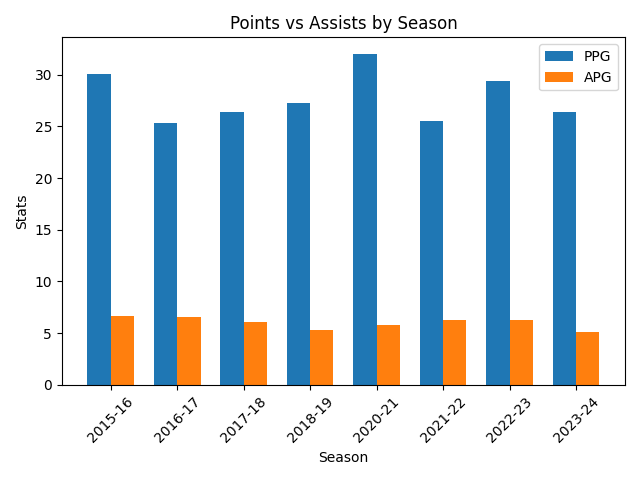
Analysis: This chart shows that Curry is not only a scorer but also a strong playmaker. Comparing points and assists side by side makes it easier to see that his offensive value comes from more than one skill. A grouped bar chart is effective because it lets the viewer compare two statistics for the same season quickly.
Chart 3: Three-Point Percentage Over Time
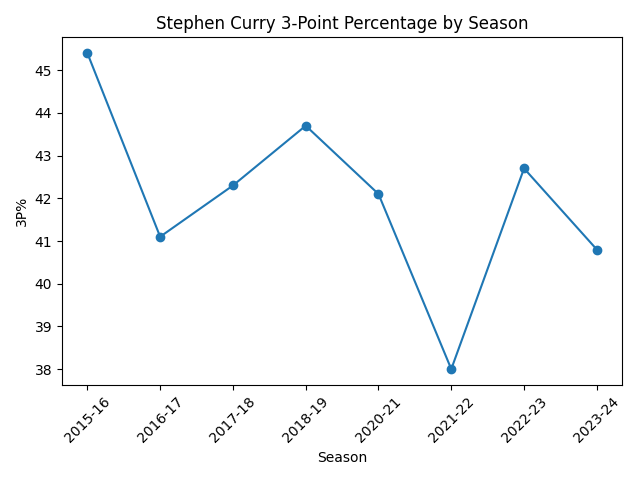
Analysis: This chart supports the argument that Curry’s shooting has remained historically elite. Even when his scoring changes, his three-point percentage stays at a very high level. This visualization is effective because shooting efficiency is easiest to understand when it is tracked across seasons.
Conclusion
Stephen Curry’s career data shows sustained scoring, elite shooting, and strong playmaking. The charts together support the argument that he is one of the most efficient and influential offensive players in basketball history.